HydroWASTE_v10 <- readr::read_csv('https://raw.githubusercontent.com/rfordatascience/tidytuesday/master/data/2022/2022-09-20/HydroWASTE_v10.csv')Data Context
The visualization uses TidyTuesday’s Wastewater Plants dataset (Sep 2022), whose data context and information can be accessed at this link
Research Question
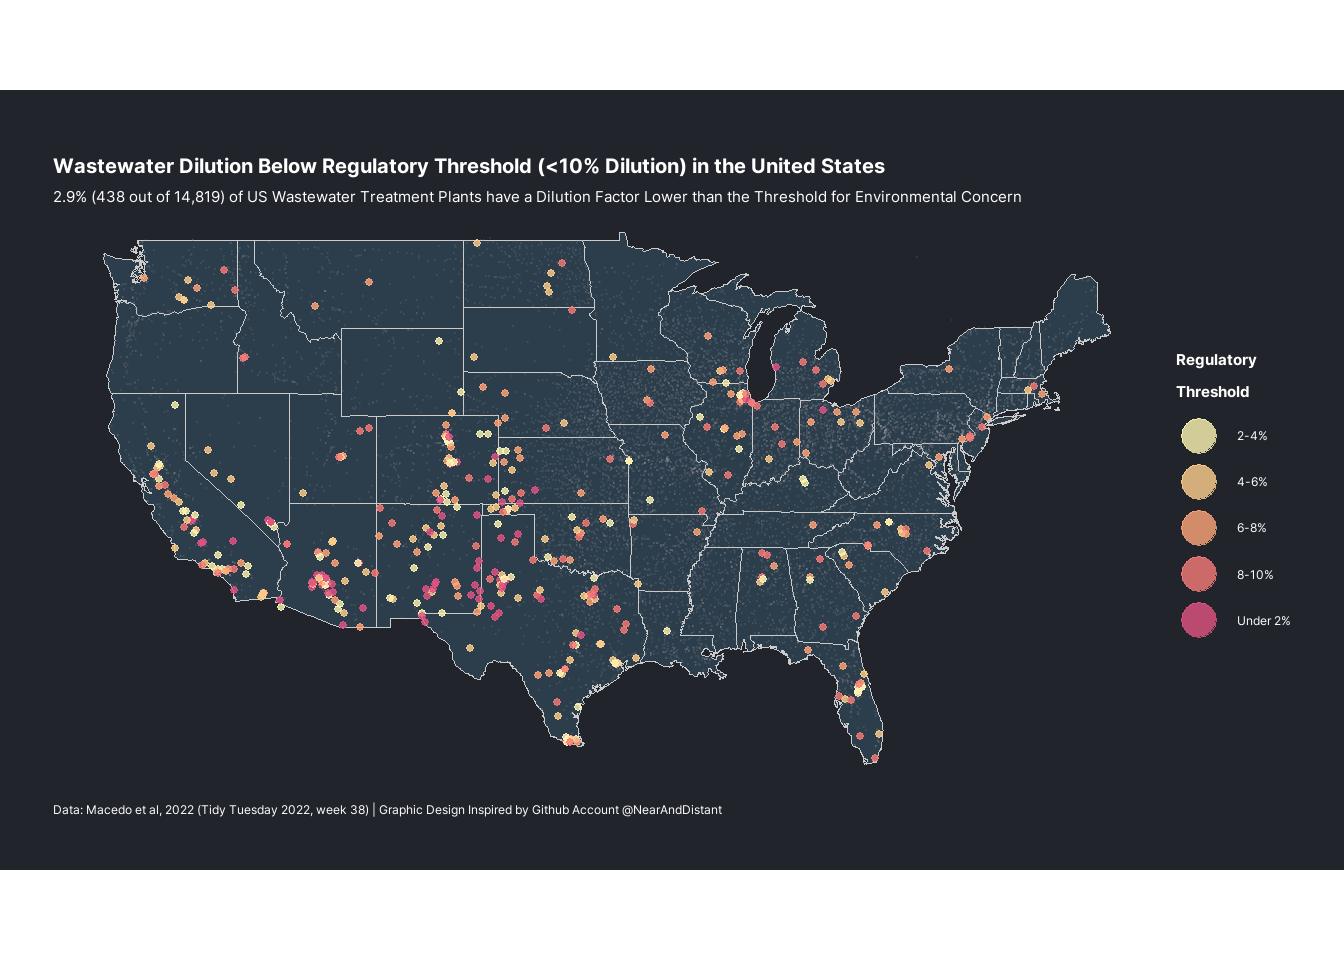
Out of all U.S. wastewater treatment plants, which have a dilution factor lower than 10 (which is regarded as a threshold for environmental concern)?
Data Transformation
Code
USA_wwtp <- HydroWASTE_v10 %>%
  filter(CNTRY_ISO %in% "USA") %>%
  filter(!is.na(DF)) %>%
  mutate(threshold = if_else(DF < 10, "lower", "within")) %>%
  mutate(df_cut = case_when(DF < 2 ~ "Under 2%",
                            DF >= 2 & DF <  4 ~ "2-4%",
                            DF >= 4 & DF <  6 ~ "4-6%",
                            DF >= 6 & DF <  8 ~ "6-8%",
                            DF >= 8 & DF < 10 ~ "8-10%"))
Data Visualization
Code
n1 <- HydroWASTE_v10 %>%
  filter(CNTRY_ISO %in% "USA") %>%
  nrow()

n2 <- USA_wwtp %>%
  filter(threshold == "lower") %>%
  nrow()

n2*100/n1
[1] 2.955665Code
showtext_auto()

usa <- st_as_sf(maps::map("state", fill=TRUE, plot = FALSE))

ggplot(usa) +
  geom_sf(color = "grey80", fill = "#2C3E4C", size = 0.125) +
  geom_point(data = USA_wwtp %>% filter(threshold == "within"), aes(LON_OUT, LAT_OUT), alpha = 0.1, size = 0.08, color = "#949398FF") +
  geom_point(data = USA_wwtp %>% filter(threshold == "lower"), aes(LON_OUT, LAT_OUT, color = df_cut), alpha = 0.8, size = 1) +
  guides(colour = guide_legend(override.aes = list(size = 6, alpha = 0.8))) +
  labs(title = "Wastewater Dilution Below Regulatory Threshold (<10% Dilution) in the United States", subtitle = "2.9% (438 out of 14,819) of US Wastewater Treatment Plants have a Dilution Factor Lower than the Threshold for Environmental Concern", color = str_wrap("Regulatory Threshold", 8), caption = "Data: Macedo et al, 2022 (Tidy Tuesday 2022, week 38) | Graphic Design Inspired by Github Account @NearAndDistant") +
  rcartocolor::scale_color_carto_d(palette = "PinkYl") +
  coord_sf(lims_method = "geometry_bbox") +
  theme_void() +
  theme(legend.position   = "right",
        text = element_text(color = "white", family = "Inter"),
        legend.title      = element_text(face = "bold"),
        plot.title        = element_text(color = "white", face = "bold", size = 15),
        plot.caption      = element_text(hjust = 0),
        panel.background  = element_rect(fill = "#21242b", color = "#21242b"),
        plot.background   = element_rect(fill = "#21242b", color = "#21242b"),
        plot.margin       = margin(20,20,20,20, unit = "pt"))
South Central region (especially around Northwest Texas region) and California have a higher concentration of wastewater treatment plants with a dilution factor below regulatory threshold.
Credit
The visualization uses the template from Github user @NearAndDistant at this link